Tutorial on conducting statistical test on cluster memberships. This helps ascertain whether individual data points are correctly assigned to a data-dependent cluster. For technical details, refer to NC Chung (2020)1. While this tutorial uses a built-in
The jackstraw R package is available from CRAN (stable) and Github (dev).
Introduction
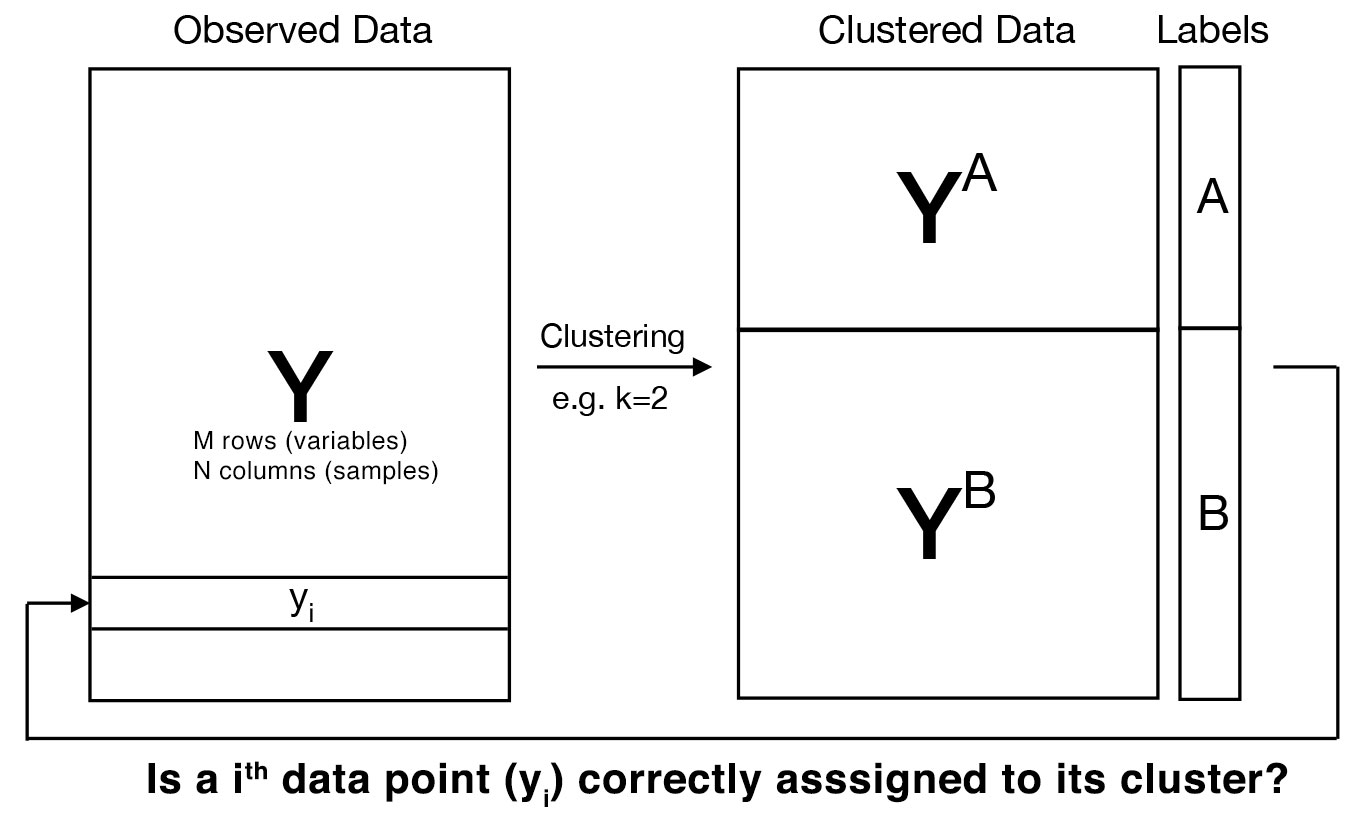
Clustering algorithms can classify data points in an unsupervised manner. Specifically, clustering can provide how to divide M data points (of N dimensions) into K clusters. Most of popular clustering algorithms are so-called “hard clustering”, meaning that each of M data points is univocally assigned to one of K clusters. This establishes cluster memberships of M data points across K clusters. Then, how can we evaluate cluster membership of M data points?
Example of mtcars
For example, let’s consider a mtcars dataset of M=32 cars and their characteristics from 1974 Motor Trend US magazine. By applying clustering to M=32 cars, we can obtain groups of cars that exhibit similar characteristics. Let’s imagine how M=32 cars are classified into K=2 clusters using K-means clustering. After clustering is done, our goal is then to evaluate (e.g., calculate statistical significance) how well these cars have been placed into 2 different cluters.
Jackstraw test for cluster membership
In a large and noisy dataset, some data points may have been incorrectly clustered or contains no significant signals. The jackstraw test for cluster membership helps evaluate whether data points are correctly assigned to their given clusters.
We are conducting hypothesis testing of association between a cluster center and an individual data point (of N dimensions)2. This provides p-values and posterior inclusion probabilities (PIPs), which you can use to identify data points that are reliably associated with that cluster.
R code
Let’s look at how to do this, using the R package jackstraw. The key function is jackstraw_kmeans calculating the jackstraw p-values when applying K-means clustering. Also, jackstraw_pam and jackstraw_MiniBatchKmeans are for Partitioning Around Medoids (PAM) and Mini Batch K-means clustering. A generic algorithm which you may use other clustering algorithms is available on jackstraw_cluster.
We process mtcars (a built-in dataset in R) for clustering. Remove 2 binary columns and normalize each column3.:
# see the summary of mtcars dataset
head(mtcars)
## mpg cyl disp hp drat wt qsec vs am gear carb
## Mazda RX4 21.0 6 160 110 3.90 2.620 16.46 0 1 4 4
## Mazda RX4 Wag 21.0 6 160 110 3.90 2.875 17.02 0 1 4 4
## Datsun 710 22.8 4 108 93 3.85 2.320 18.61 1 1 4 1
## Hornet 4 Drive 21.4 6 258 110 3.08 3.215 19.44 1 0 3 1
## Hornet Sportabout 18.7 8 360 175 3.15 3.440 17.02 0 0 3 2
## Valiant 18.1 6 225 105 2.76 3.460 20.22 1 0 3 1# remove two binary columns
car <- as.matrix(mtcars[,-c(8,9)])
zcar <- apply(car, 2, function(x) (x-mean(x))/sd(x))In this example, another R package anocva is used determine the number of clusters. However, this completely depends on your data, applications, and analysis goals. Please carry out careful exploratory data analysis.:
# install.packages("anocva")
library(anocva)
myKmeans = function(dist, k){
  return(kmeans(dist, k, iter.max = 100, nstart = 10)$cluster)
  }
distMatrix = as.matrix(dist(zcar))
distMatrix = checkRange01(distMatrix)
nClust(distMatrix, p = 1, maxClust = 10, myKmeans)
## [1] 2We apply K-means clustering to the normalized mtcars dataset. The function kmeans cluster 32 cars in this dataset. The jackstraw test for cluster membership with B=1000 iteration is applied. We choose s=3, approximately 10% of the cars:
# set a rng seed for reproducibility
set.seed(1)
# apply k-means clustering
kmeans.car = kmeans(zcar, centers=2, nstart = 10, iter.max = 100)

library(jackstraw)
# apply k-means clustering
jackstraw.out <- jackstraw_kmeans(dat=zcar,
                                  kmeans.dat=kmeans.car,
                                  s=3,
                                  B=1000,
                                  nstart = 10,
                                  iter.max = 100)
jackstraw.out$pip <- pip(jackstraw.out$p.F)
Here are a few histograms to look at. For example, one may look at observed and null F-statistics for diagnostic reasons. We could use PIPs to filter or select some cars that are not good fits for that clusters.:
library(ggplot2)
library(tibble)
ggplot(as_tibble(jackstraw.out$p.F),aes(value)) +
  geom_histogram(binwidth=.1,center = .05) +
  labs(title = "P-values of cluster memberships")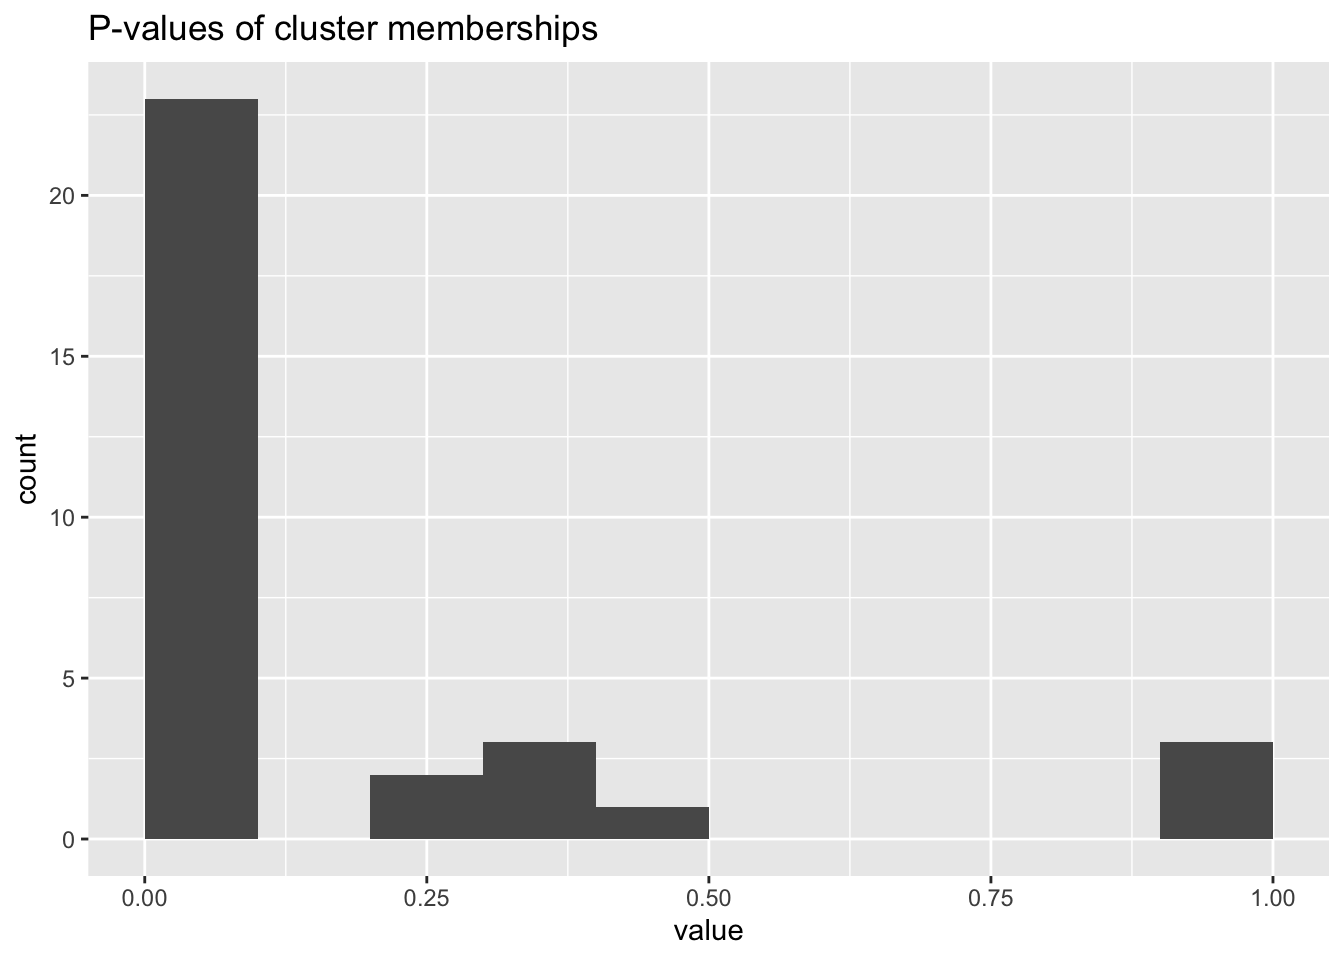
ggplot(as_tibble(jackstraw.out$pip),aes(value)) +
  geom_histogram(binwidth=.1,center = .05) +
  labs(title = "Posterior inclusion probabilities")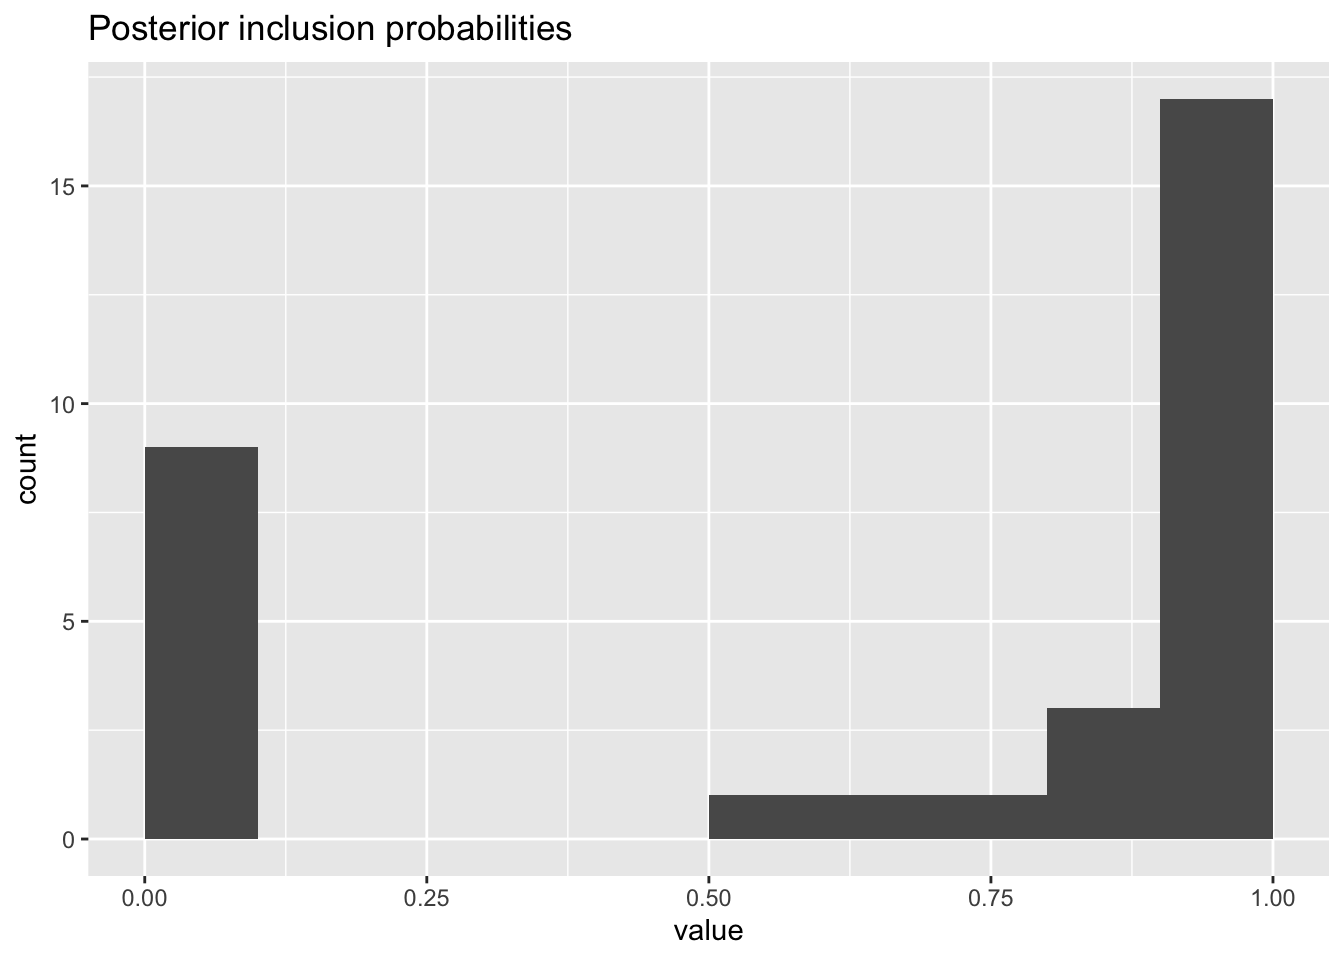
ggplot(as_tibble(jackstraw.out$F.obs),aes(value)) +
  geom_histogram(binwidth=20,center = 10) +
  labs(title = "Observed F-statistics")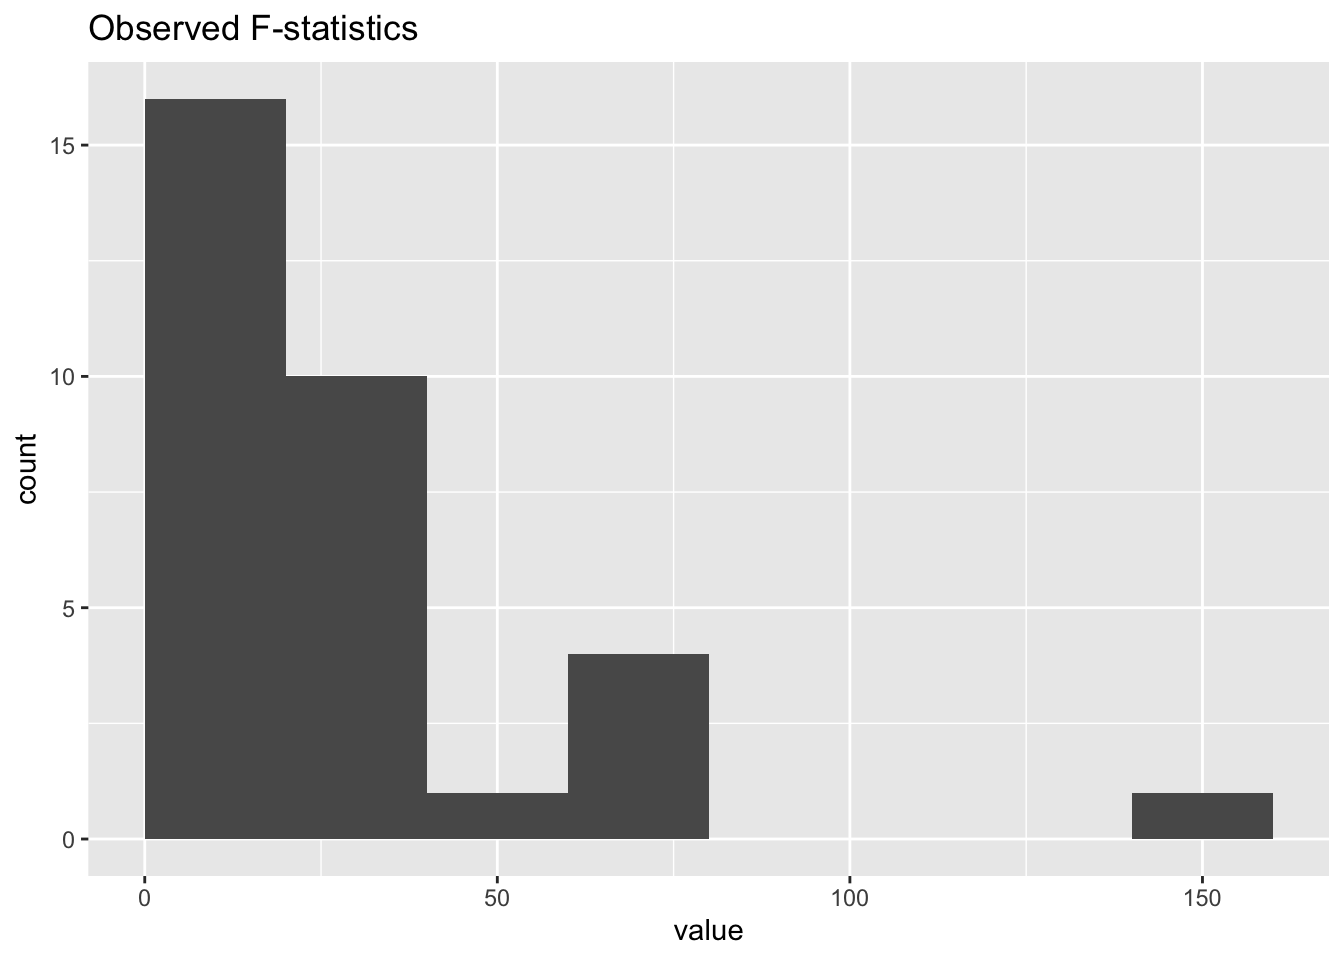
The jackstraw algorithm
An empirical distribution of association statistics under the null hypothesis must account for the fact that clustering depends on observed data. If clusters or cluster centers are used directly against the observed data (from which these clusters are derived from), it’s called circular analysis, resulting in spurious associations and artificially inflated significances.
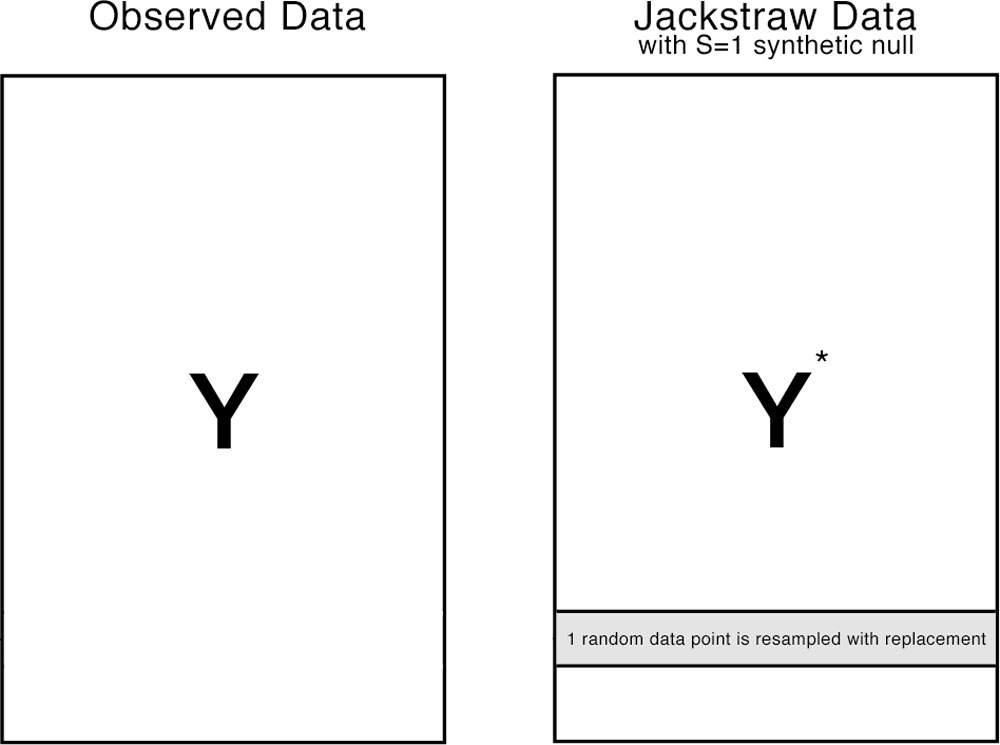
The jackstraw randomly chooses S data points (or rows in our example), where S is much smaller than N (N >> S). Each of S data points is resampled with replacement, resulting in S synthetic data points. The jackstraw data is a hybrid dataset consisted of N-S observed data points and S synthetic null data points. Then, the same clustering algorithm is applied on the jackstraw data, where association statistics between the cluster centers and S synthetic nulls are calculated. By repeating this resampling strategy B times, we obtain B * s null statistics, that forms an empirical distribution.
How is this different from bootstraping?
Bootstrapping or other resampling plans create a completely null dataset, in which no cluster structure exists. In contrast, we want to preserve the overall cluster structure, such that K clusters still exist in the jackstraw data and their cluster centers are asymptotically identical to their original centers. Since those synthetic nulls do not belong to any cluster, we can use them to establish a empirical distribution of null association statistics.
P-value troubleshooting
Always, examine the histogram of p-values. Behaviors of p-values are important, and even allow us to diagnose the problems with data, algorithms, or hyperparameters. Please see a blog post by David Robinson on how to interpret a p-value histogram5.
Posterior inclusion probabilities (PIPs) are empirical Bayesian measures, that are calculated from the set of p-values. It’s simply 1 - lfdr (local false discovery rate). For an introduction, see a blog post by Michael Love on Intuition behind local FDR6. There are several ways7 to estimate lfdr. By default, we use the qvalue package.
You may get into an error due to unability to estimate a proportion of null hypotheses, pi08. Underneath, qvalue::pi0est is used and in some cases, an optional argument lambda may help. Also, try to set pi0=1 manually or estimate pi0 in some other ways.
NC Chung (2020) Statistical significance of cluster membership for unsupervised evaluation of cell identities. Bioinformatics 36 (10)↩︎
For computing F-statistics, the full model uses the cluster centers (and possibly other covariates). The null model excludes cluster centers.↩︎
You may not want different scales of variables to impact clustering.↩︎
See silhouette analysis, gap statistics, and so on.↩︎
qvalue, locfdr, fdrtool, etc↩︎
See the qvalue Github issue↩︎