This tutorial explains application of the jackstraw test for cluster membership to single cell genomics, shown in NC Chung (2020)1. Two cell types (Jurkat and 293T cell lines) are estimated by clustering and evaluated by the jackstraw.
Introduction from Chung (2020)
Single-cell RNA-sequencing (scRNA-seq) allows us to dissect transcriptional heterogeneity arising from cellular types, spatio-temporal contexts and environmental stimuli. Transcriptional heterogeneity may reflect phenotypes and molecular signatures that are often unmeasured or unknown a priori. Cell identities of samples derived from heterogeneous subpopulations are then determined by clustering of scRNA-seq data. These cell identities are used in downstream analyses. How can we examine if cell identities are accurately inferred? Unlike external measurements or labels for single cells, using clustering-based cell identities result in spurious signals and false discoveries.
We introduce non-parametric methods to evaluate cell identities by testing cluster memberships in an unsupervised manner. Diverse simulation studies demonstrate accuracy of the jackstraw test for cluster membership. We propose a posterior probability that a cell should be included in that clustering-based subpopulation. Posterior inclusion probabilities (PIPs) for cluster memberships can be used to select and visualize samples relevant to subpopulations.
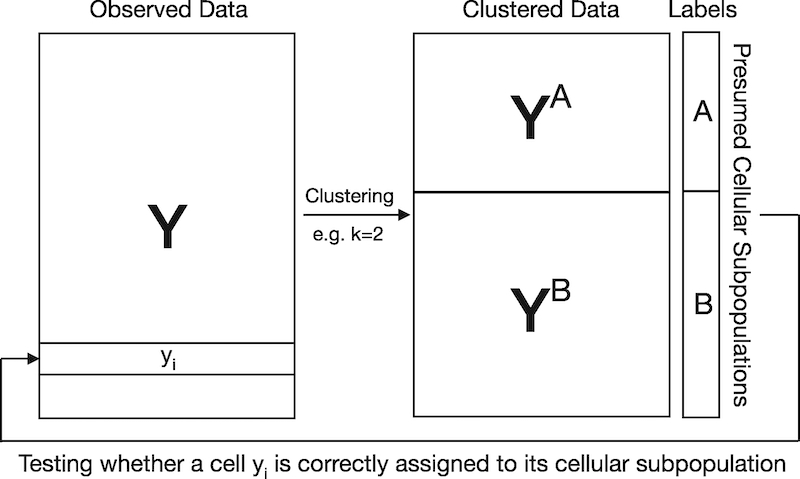
Visual explanation for circular analysis in naively evaluating cluster memberships. In this example, scRNA-seq data are clustered to obtain K=2 cellular subpopulations. Since cell identities are estimated by clustering scRNA-seq data, testing if a cell is correctly assigned to its presumed cellular subpopulation results in artificially inflated significance. The proposed jackstraw for clustering overcomes this challenge by learning the overfitting inherent in evaluating cluster membership
Cells from a mixture of Jurkat and 293T cell lines (50:50) were sequenced using GemCode by 10× Genomics (Zheng et al., 2017)2. Jurkat and 293T cell lines are highly distinct, being derived from male and female individuals, respectively. Zheng et al. (2017) applied K-means clustering that separates m=3381 cells into K=2 subpopulations. Following quality control, normalization, gene selection and dimension reduction in the original analysis, we tested whether individual cells are correctly assigned to one of two subpopulations based on the top 10 PCs of UMI.
Using the jackstraw to evaluate clustering-based cell identities
We followed the original analysis given in Zheng G.X. et al. (2017) – particularly, quality control and filtering, dimension reduction, and K-means clustering. Let’s load the first 10 principal components (PCs) of 293T:Jurkat data from Supplementary Data 1 of Zheng et al., 2017. Then we apply and visualize K-means clustering:
library(jackstraw)
library(ggplot2)

dat <- read.csv("ncomms14049-s2.csv")
dat <- dat[dat$Sample == "50%:50% Jurkat:293T",]
dat <- dat[,-1]
Jurkat293T <- dat

set.seed(0)
dat.plot <- dat
k <- kmeans(dat,2,iter.max=100, nstart = 100)
dat.plot$k <- k$cluster
g <- ggplot(dat.plot,aes(PC1,PC2,col=as.factor(k)))+geom_point(size=0.2,alpha=1)+theme_classic()+
   scale_color_manual(values=c("navyblue","chartreuse4"))
print(g)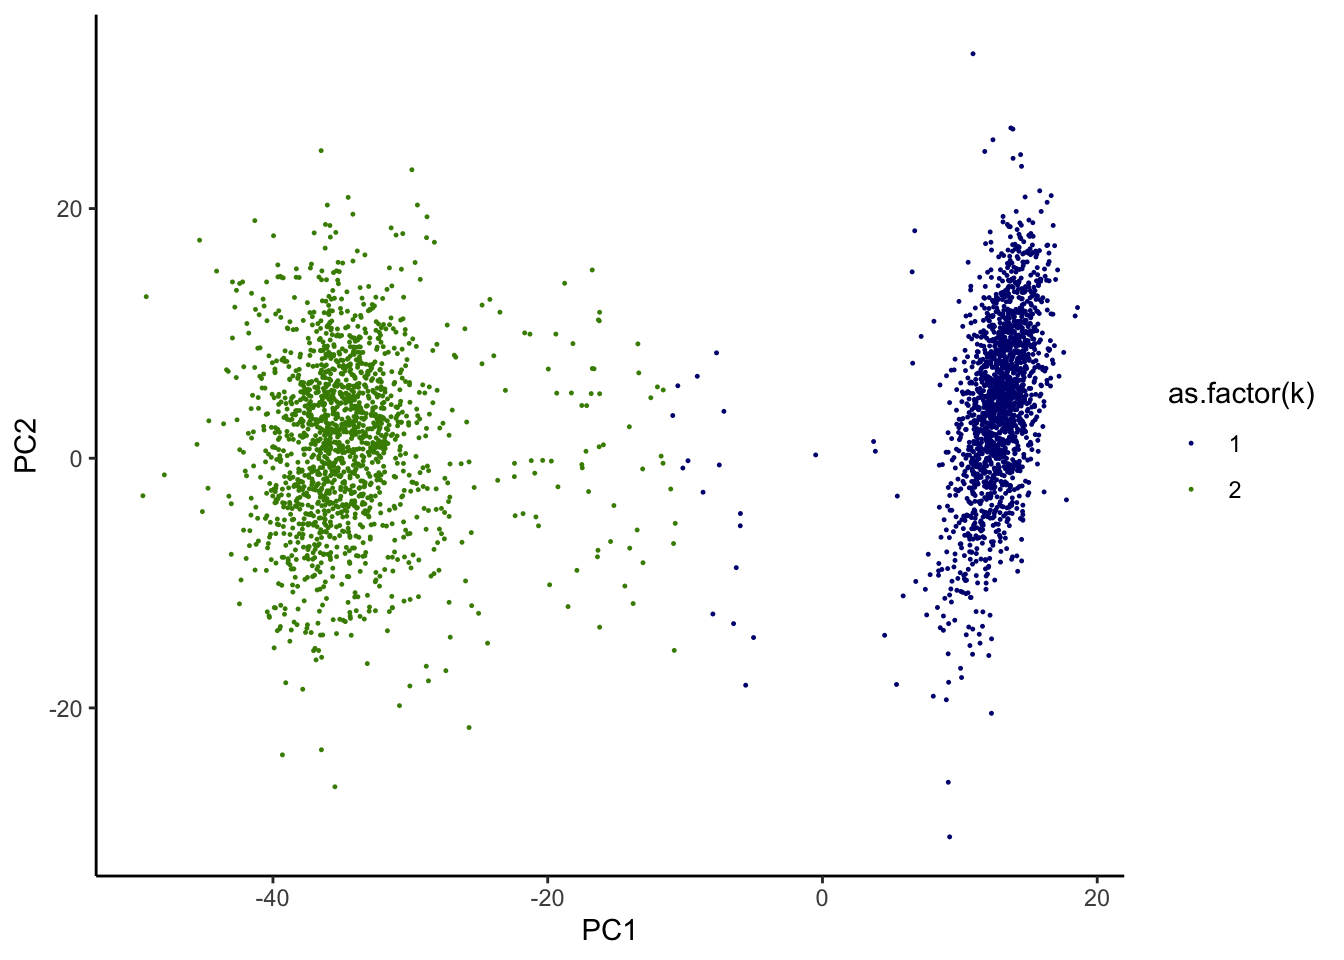
We noticed that while the most of cells seem to be well contained in 2 separated clusters, some cell identities appear to be more ambiguous. We are interested in identifying those “in-between” cells.
Apply the jackstraw test for cluster membership to obtain p-values. The important parameters are S and B. In this example, we used S=.1*M and B=1000, where M is the number of cells. Generally, keep S small compared to M. At the same value of S, a bigger B leads to a higher resolution of p-values.
set.seed(0)
js <- jackstraw_kmeans(as.matrix(dat), kmeans.dat=k, s=round(nrow(dat)*.1), B=1000, verbose=FALSE, pool=FALSE)

dat.plot <- dat
dat.plot$k <- k$cluster
dat.plot$Pvalue <- js$p.F

ggplot(dat.plot,aes(Pvalue))+
  geom_histogram(bins = 30) +
theme_minimal() 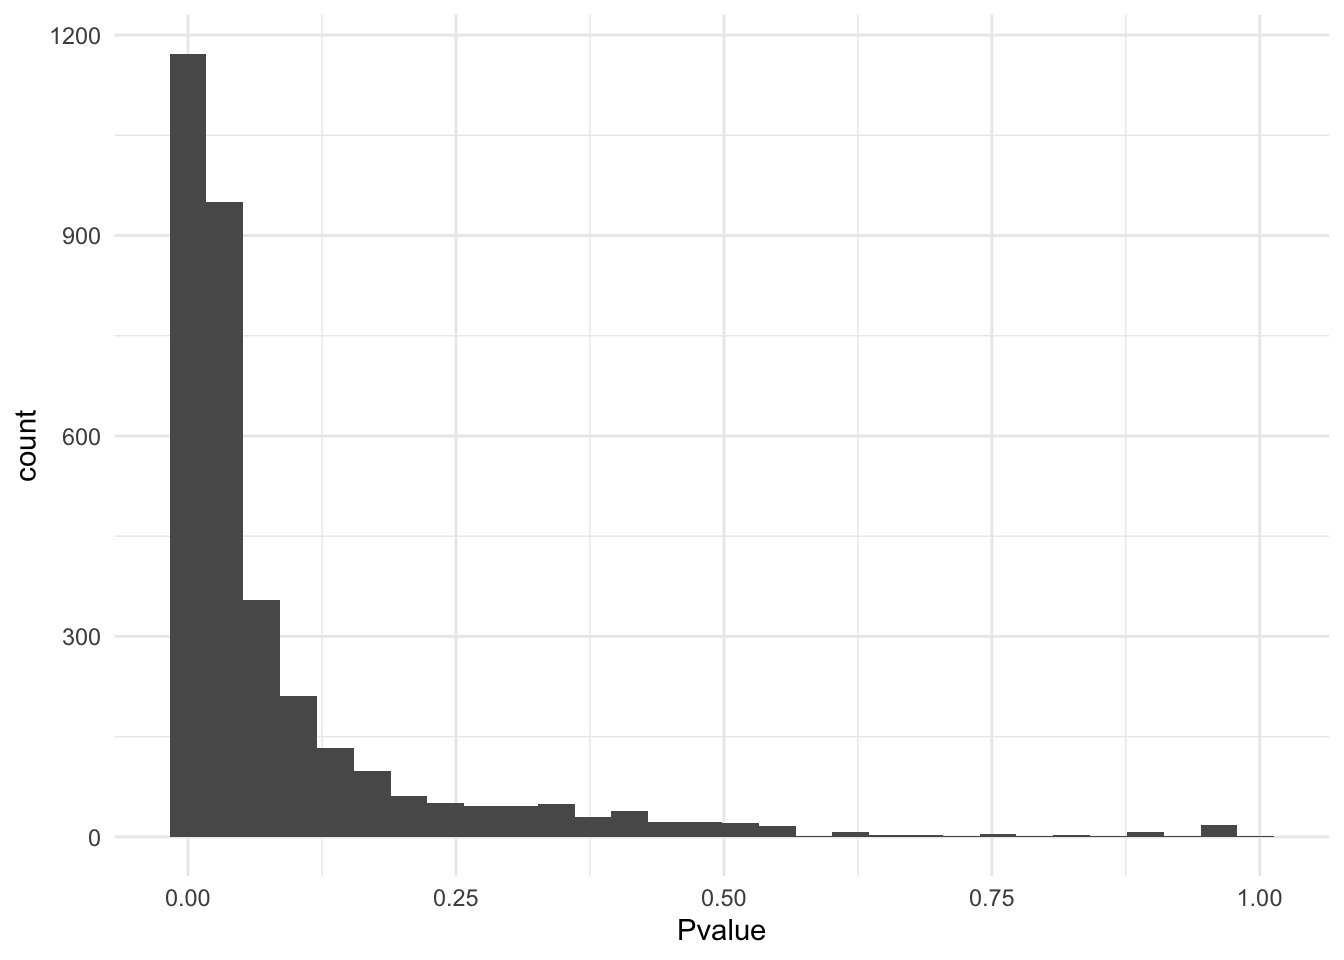
g.pvalue <- ggplot(dat.plot,aes(PC1,Pvalue))+
  geom_point(aes(col=as.factor(k),shape=as.factor(k)), size=0.6) +
  scale_colour_manual(guide = guide_legend(title = "Cluster",order = 1), labels = c("1","2"), values = c("navyblue","chartreuse4"))+
  scale_shape_manual(guide = guide_legend(title = "Cluster",order = 1), labels = c("1","2"), values = c(16,17)) +
  theme_minimal() + theme(legend.position="none")
print(g.pvalue)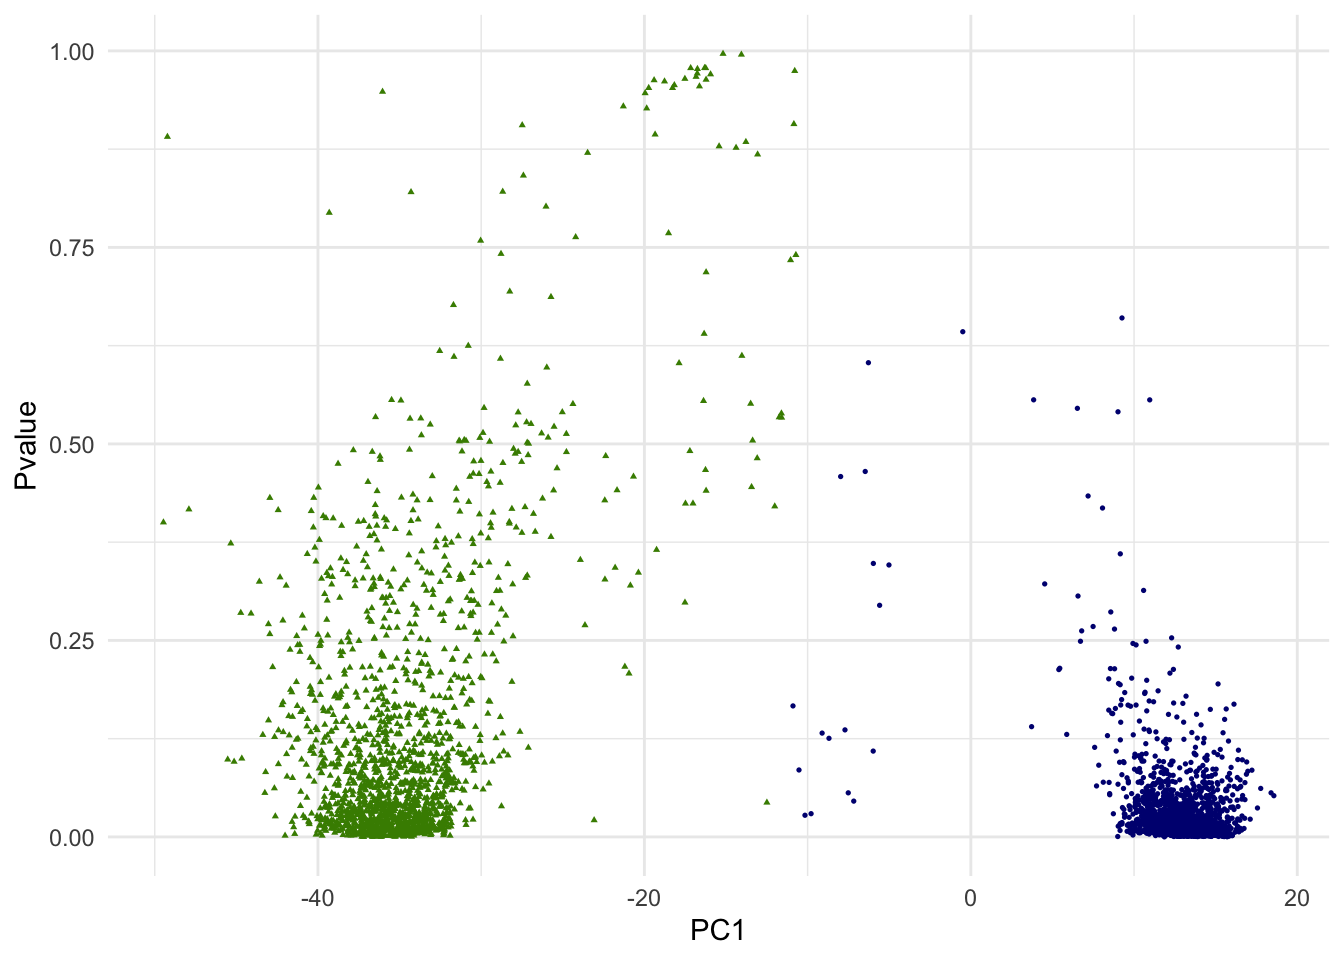
In the above scatterplot of the 1st PC and p-values, we are simply attempting to visualize it in one of many ways. Since we are dealing with 10 PCs of high dimensional data, how data points (single cells) are positioned with regarding to two clusters is more complex.
Posterior inclusion probabilities (PIPs)
We are interested in calculating a posterior probability that a cell should be included in that given cluster. This is called posterior inclusion probability (PIP), which is analogous to 1-lfdr (local false discovery rate).
This requires estimating a proportion of null hypotheses, \(\pi_0\). Quantitatively, there are a few different ways to estimate. We recommend the qvalue R/Biocondutor package.
library(qvalue)
pi0_qvalue <- qvalue::pi0est(js$p.F)$pi0
pi0_qvalue
## [1] 0.06534966Somestimes, the estimation of \(\pi_0\) could be problematic. For some tips and helps, see on the GitHub iusse.
- Setting \(\widehat{\pi_0} = 1\) is a very conservative approach by completely sidestepping this estimation process: in the function
jackstraw::pip, setpi0=1. - If the p-values are all small, fitting a spline may not work. Possibly add a p-value of 1 into your set of p-values before estimating \(\pi_0\):
qvalue::pi0est(c(js$p.F, 1)). - Alternatively, seek other \(\pi_0\) estimators that may be more suitable for your data: e.g., the
mutossR package. - Here, \(\pi_0\) is estimated for the whole dataset. It might be better to estimate \(\pi_0\) for each group, if the observed data is sufficiently big.
With \(\widehat{\pi_0}\), we estimate PIPs. And visuaslize p-values and PIPs with ggplot2:
# using the jackstraw package to calculate PIPs
pipout = pip(js$p.F, group=k$cluster, pi0=pi0_qvalue)

# visualization-related packages
library(Matrix)
require(gridExtra)
library(cowplot)

dat.plot <- dat
dat.plot$k <- k$cluster
dat.plot$PIP <- pipout
dat.plot$Pvalue <- js$p.F

g.pip <- ggplot(dat.plot,aes(PC1,PIP))+
  geom_point(aes(col=as.factor(k),shape=as.factor(k)), size=0.6) +
  scale_colour_manual(guide = guide_legend(title = "Cluster",order = 1), labels = c("1","2"), values = c("navyblue","chartreuse4"))+
  scale_shape_manual(guide = guide_legend(title = "Cluster",order = 1), labels = c("1","2"), values = c(16,17)) +
  theme_minimal() + theme(legend.position="none")
print(g.pip)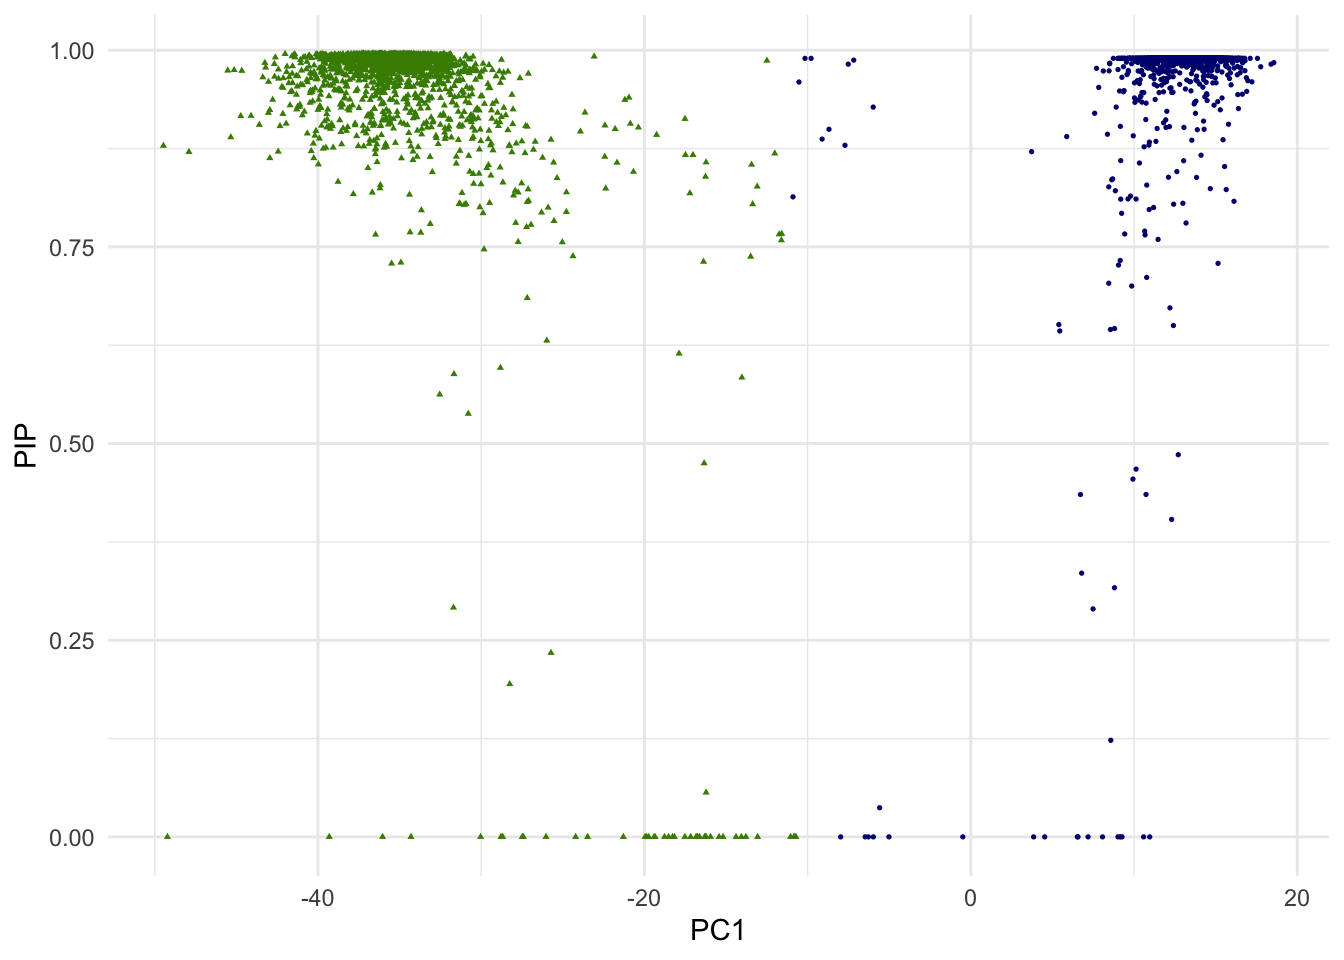
g.pvalue.pip <- ggplot(dat.plot,aes(Pvalue,PIP))+
  geom_point(aes(col=as.factor(k),shape=as.factor(k)), size=0.6) +
  geom_hline(yintercept = .8, col="red", lty="dashed") +
  scale_x_continuous(limits = c(0,1)) +
  scale_colour_manual(guide = guide_legend(title = "Cluster",order = 1), labels = c("1","2"), values = c("navyblue","chartreuse4"))+
  scale_shape_manual(guide = guide_legend(title = "Cluster",order = 1), labels = c("1","2"), values = c(16,17)) +
  theme_minimal() + theme(legend.position="none")
print(g.pvalue.pip)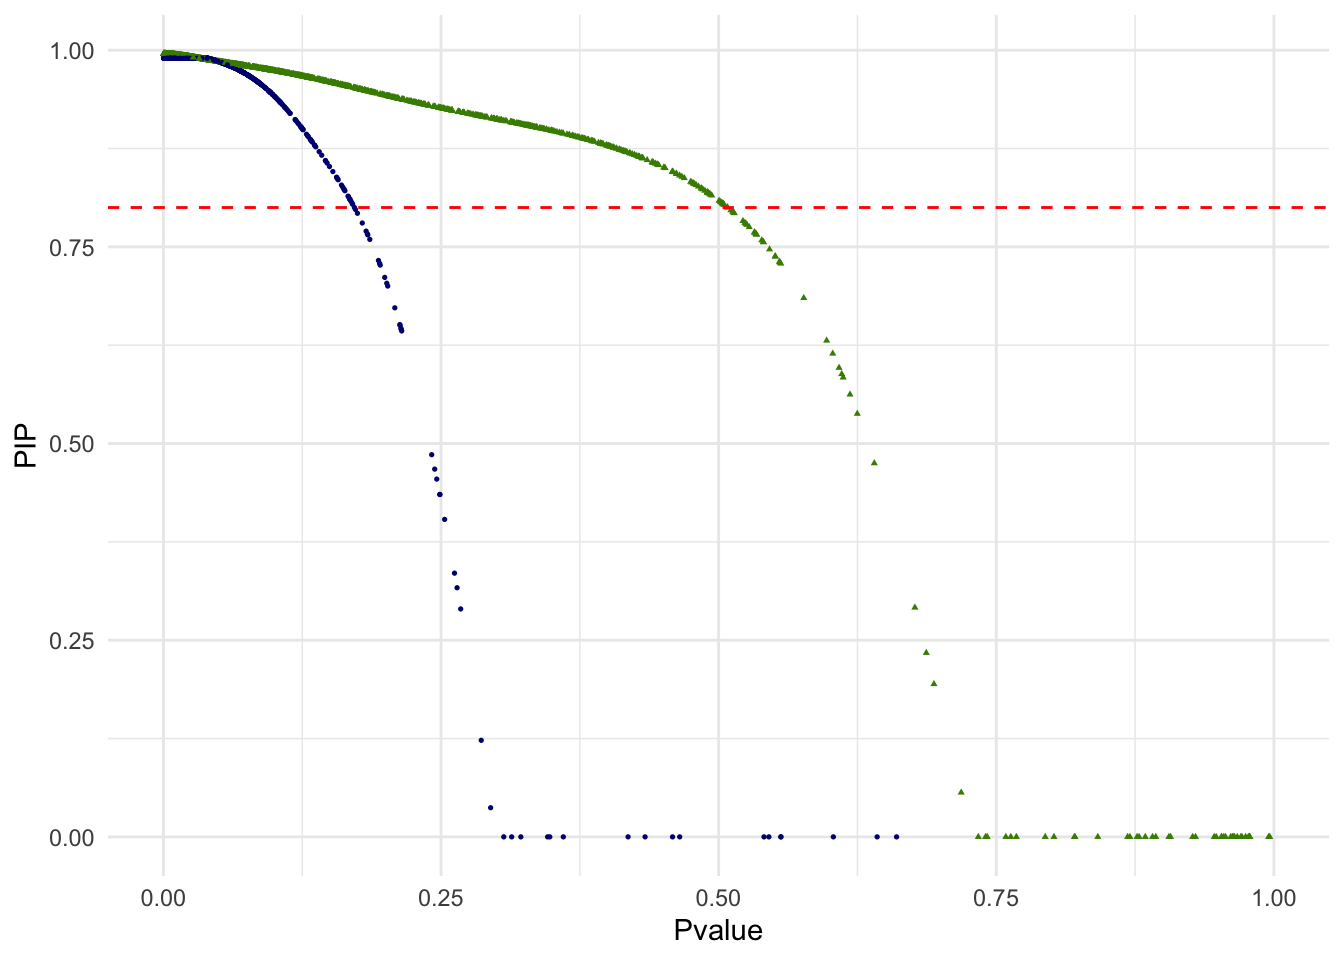
Out of 3381 single cells, 3255 are above the PIP threshold of 0.8. We may interpret other 126 singe cells as ambiguous in this unsupervised classification of two cell types and removed from the downstream analysis. In the below scatterplot of the top 2 PCs, single cells with PIP < .8 are red squares. Note that since only the top 2 PCs are shown, visual proximity should not be taken as distance to the clusters.
require(scales)
highcol <- "black"
lowcol <- "white"

dat.plot$k[dat.plot$PIP < .8] <- 3

g.pca <- ggplot(dat.plot,aes(PC1,PC2))+
  geom_point(aes(col=as.factor(k),shape=as.factor(k)), size=0.6) +
  scale_colour_manual(guide = guide_legend(title = "Cluster",order = 1, override.aes = list(size=1.5)), labels = c("1","2","Ambiguous"), values = c("navyblue","chartreuse4","red"))+
  scale_shape_manual(guide = guide_legend(title = "Cluster",order = 1), labels = c("1","2","Ambiguous"), values = c(16,17,15)) +
  theme_minimal() + theme(legend.position = "right")
print(g.pca)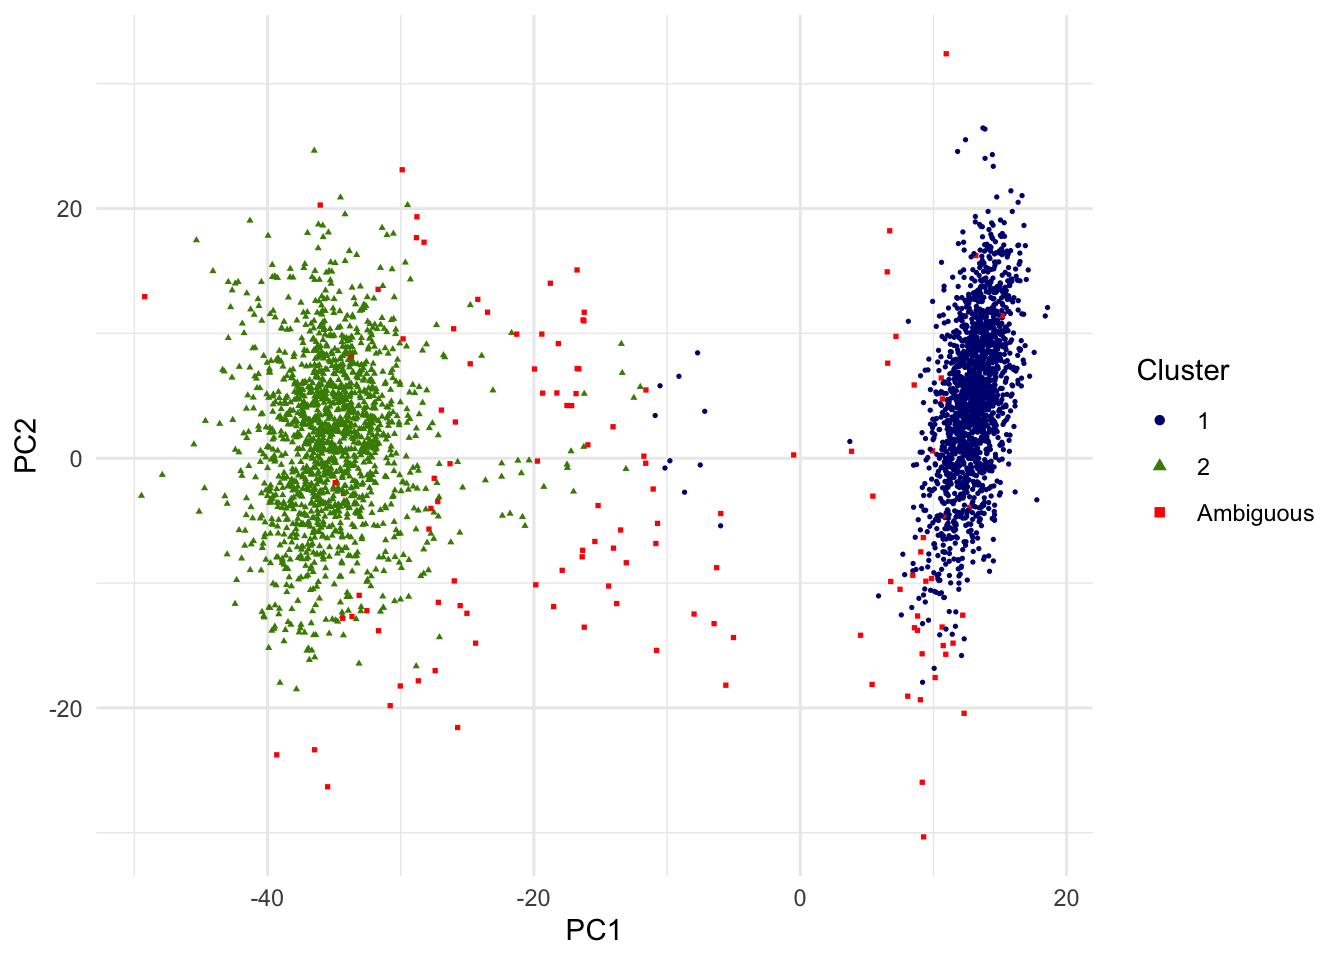
For the sake of alternative view, the scatterplot of 9th and 10th PCs are shown as well.
g.pca <- ggplot(dat.plot,aes(PC9,PC10))+
  geom_point(aes(col=as.factor(k),shape=as.factor(k)), size=0.6) +
  scale_colour_manual(guide = guide_legend(title = "Cluster",order = 1, override.aes = list(size=1.5)), labels = c("1","2","Ambiguous"), values = c("navyblue","chartreuse4","red"))+
  scale_shape_manual(guide = guide_legend(title = "Cluster",order = 1), labels = c("1","2","Ambiguous"), values = c(16,17,15)) +
  theme_minimal() + theme(legend.position = "right")
print(g.pca)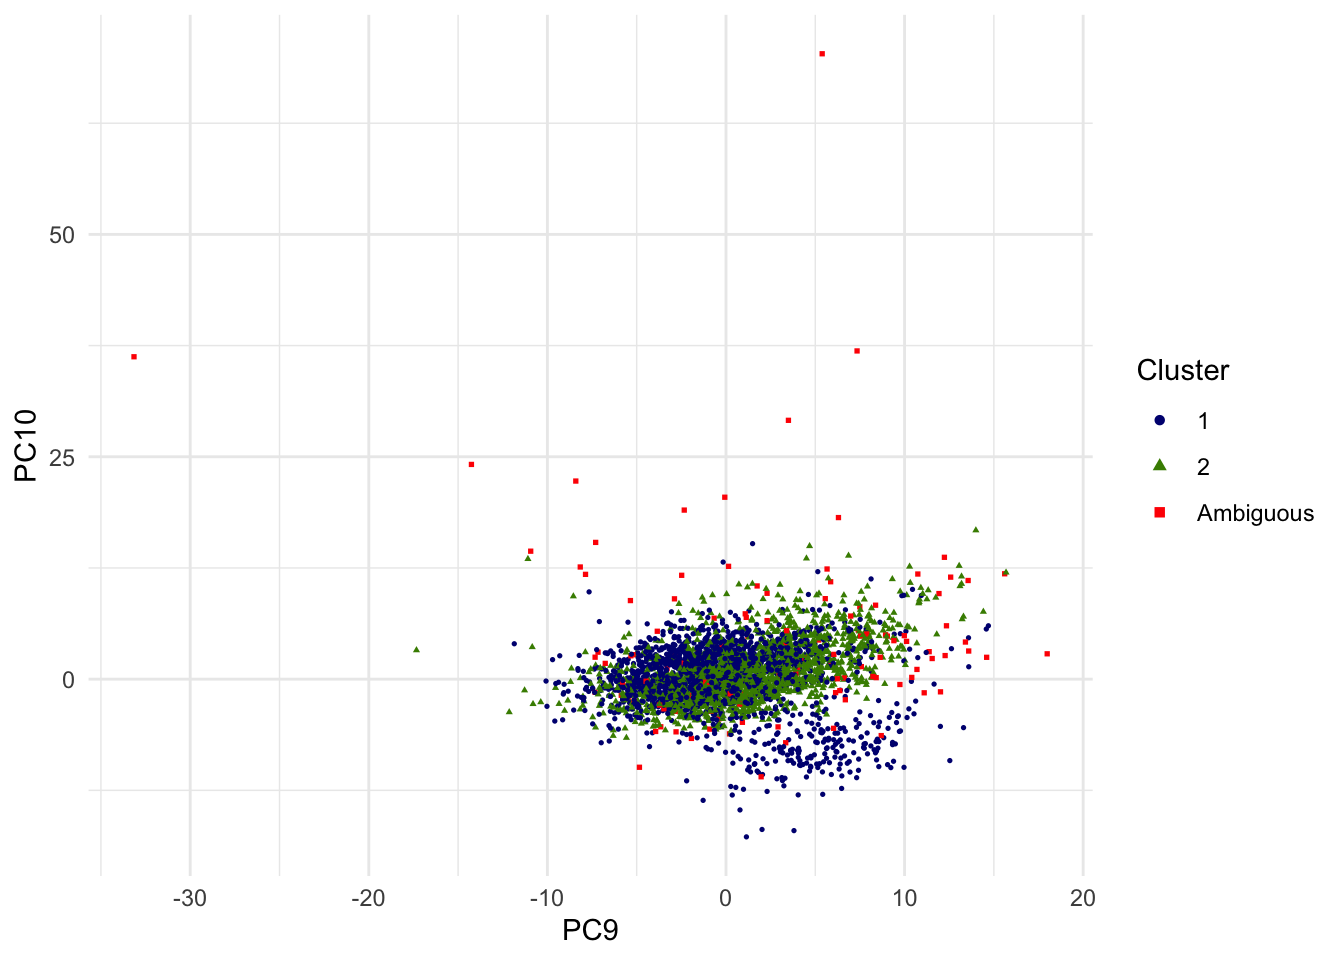
In droplet-based scRNA-seq, single cell isolation may fail and a droplet mistakenly includes two or more cells (called doublets and multiplets)3. There are algorithms that are specifically developed to deal with doublets and multiplets such as DoubletFinder (McGinnis et al., 2019), DoubletDecon (DePasquale et al., 2018), Scrublet (Wolock et al., 2019), Solo (Bernstein et al., 2020), scds (Bais and Kostka, 2020), and DSAVE (Gustafsson et al. 2020). The jackstraw is complementary to these tools; see more details/comparisons in the Supplementary Information.
NC Chung (2020) Statistical significance of cluster membership for unsupervised evaluation of cell identities. Bioinformatics 36 (10)↩︎
Zheng G.X. et al. (2017) Massively parallel digital transcriptional profiling of single cells. Nat. Commun.↩︎
Chapter 16 Doublet detection, Orchestrating Single-Cell Analysis with Bioconductor↩︎